Dot Curves: changing dot distribution
The dot distribution can be changed by altering the curves of each dot size by pulling the curves and changing Max amount and Dot weight values
Changing the dot distribution by dragging each dot curve
In case where you wish to e.g. eliminate the use of certain drop sizes or to change the drop size entry point, you can drag each dot size line on the graph selecting the dots on the graphs
In the below example only Large dots are used.
Max Amount
This is the dot% which is found in the ink settings window.
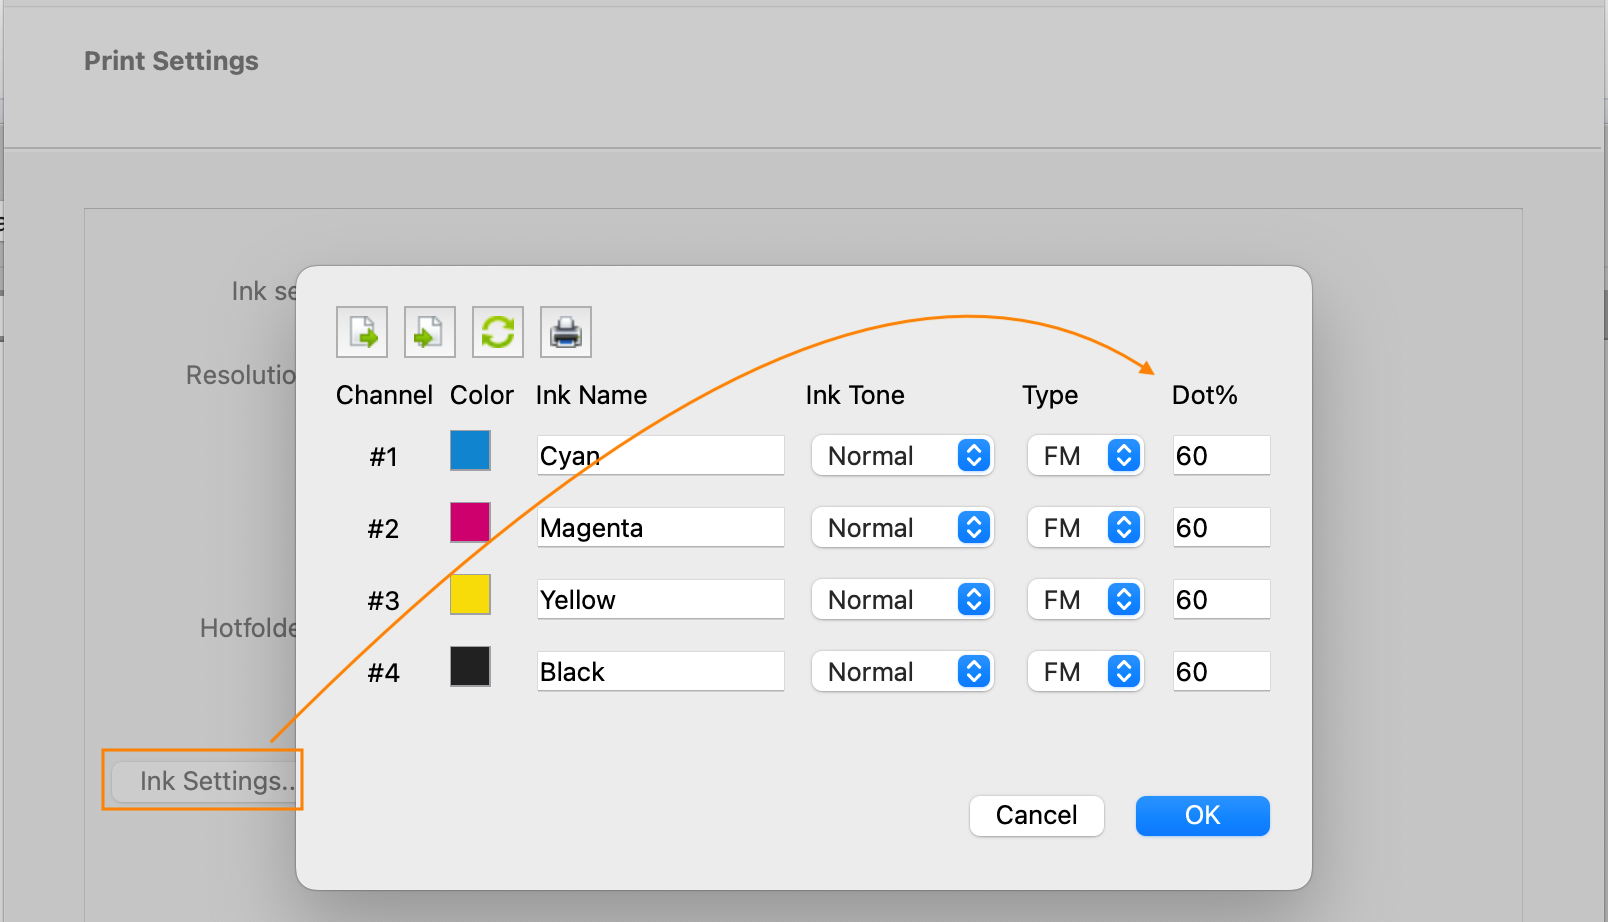
It defines the distribution between S, M and L dots. 1 represents 100%. The default value of dot% is 60% -> 0.6 Max amount
Basically, the higher the dot % or Max amount the more Small dots are used compared to Large. Explained in charts below.
It defines the distribution between S, M and L dots. 1 represents 100%. The default value of dot% is 60% -> 0.6 Max amount
Basically, the higher the dot % or Max amount the more Small dots are used compared to Large. Explained in charts below.
Left chart has Max dot: 0.6 and Right Max dot: 0.9
Looking at the orange dotted line: with Max dot 0.9, the M dot only starts when the S is at almost 100%. The transition is small, but the dot count of S dots is higher than in Max dot 0.6, where the M dot is introduced earlier and more gradual and ink usage builds up.
When would you change the dot %?
In general: not. The default of 0.6 max dot is a good setting and works in 99% of cases. In extreme cases of noise/ banding in certain dots/ areas, you could experiment with dot %.
Dot weight
The dot weight is the % of each dot size at which value this particular dot size needs to be at the max value of the dot %
In the example below we set the Max amount to 1 to clearly isolate the effect of the Dot weight.
If S is set to 0.5, that means that from 0 to 50% of ink usage: only S dots are used. With M set to 0.6 => the M dot is built up starting at 50% and reaching 100% at 60% of ink usage. From 60% onwards, the L is being introduced.
This setting shows lots of S dot usage with a short transition and rapid introduction of Medium dot over 10% whereafter L dot starts.
The default dot weight distribution of 0.33, 0.67 and 1 guarantees an equal weight distribution between the dots.
Related Articles
Dot Curves: Graphs explained
In this page we'll learn how to read the graphs before making any changes to the settings. Preview Chart The top chart reflects in pixels the distribution of the dots and in particular the dot transitions and interleave between Small, Medium and ...Dot Curve Editor Tool
The Dot Curve Editor Tool is a new addition to the Inkset-up dialog of a PMM. The button will only work when the screening is FM and more than 2 dot levels are in the print mode. This tool is in place for users with some knowledge on editing dot ...Dot Gain Correction Curve
About Dot Gain correction Dot gain correction allows for 2 uses: Compensate for dot gain curves in the imagesetter or platesetter RIP Make visual color adjustments The dot gain correction curve is saved in the ICC profile. How to edit Dot Gain curves ...Calibrator: FM, ED, SO, SD, DO dot patterns / screening
Generic info on screening Frequency Modulated (FM) Whereas conventional screening methods place dots in a grid pattern to reproduce a continuous tone image with FM screening, tone densities are varied by placing different numbers of small dots within ...Image Edit - Document Component
Image Edit Tool The Image Edit tool applies automatic image adjustments to your jobs in a PrintFactory workflow. It uses predefined presets—called Image Edit scripts—to correct tone, color, brightness, and balance, or to apply special processing such ...